A Custom ggplot2 Theme for Publication-Ready Plots
snazzieR.theme.RdThis theme provides a clean, polished look for ggplot2 plots, with a focus on readability and aesthetics. It includes a custom color palette and formatting for titles, axes, and legends.
Examples
library(ggplot2)
set.seed(123)
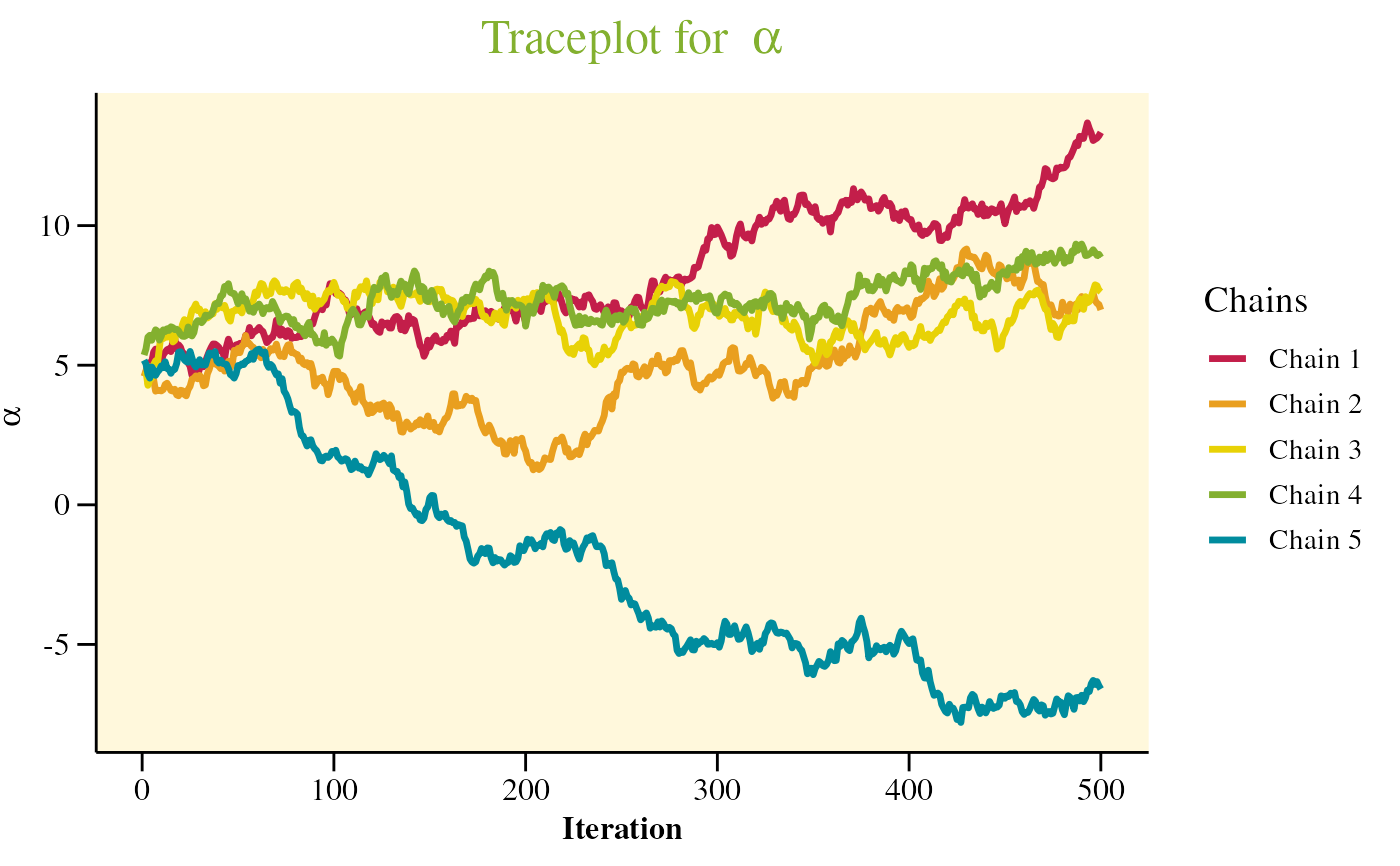
chains.df <- data.frame(
Iteration = 1:500,
alpha.1 = cumsum(rnorm(500, mean = 0.01, sd = 0.2)) + rnorm(1, 5, 0.2),
alpha.2 = cumsum(rnorm(500, mean = 0.005, sd = 0.2)) + rnorm(1, 5, 0.2),
alpha.3 = cumsum(rnorm(500, mean = 0.000, sd = 0.2)) + rnorm(1, 5, 0.2),
alpha.4 = cumsum(rnorm(500, mean = -0.005, sd = 0.2)) + rnorm(1, 5, 0.2),
alpha.5 = cumsum(rnorm(500, mean = -0.01, sd = 0.2)) + rnorm(1, 5, 0.2)
)
chain.colors <- c("Chain 1" = Red, "Chain 2" = Orange, "Chain 3" = Yellow,
"Chain 4" = Green, "Chain 5" = Blue)
ggplot(chains.df, aes(x = Iteration)) +
geom_line(aes(y = alpha.1, color = "Chain 1"), linewidth = 1.2) +
geom_line(aes(y = alpha.2, color = "Chain 2"), linewidth = 1.2) +
geom_line(aes(y = alpha.3, color = "Chain 3"), linewidth = 1.2) +
geom_line(aes(y = alpha.4, color = "Chain 4"), linewidth = 1.2) +
geom_line(aes(y = alpha.5, color = "Chain 5"), linewidth = 1.2) +
labs(x = "Iteration", y = expression(alpha),
title = expression("Traceplot for " ~ alpha)) +
scale_color_manual(values = chain.colors, name = "Chains") +
snazzieR.theme()